Data Professional Demographics & Sentiment Analysis
Engineered an interactive Power BI dashboard analyzing a global survey of 630 data professionals. The report visualizes salary benchmarks, programming language preferences, and career entry sentiment.
The Objective
To transform raw, unstructured survey data into a clear, executive-facing BI report. The goal was to identify macro-trends in the data science industry, specifically exploring if high compensation correlates with job satisfaction, and which technical skills are most dominant across various roles.
BI & Analytics Stack
- • Power BI (Data Visualization)
- • Power Query (Data Cleaning & ETL)
- • DAX (Custom Measures & KPIs)
- • Excel (Raw Data Source)
Executive Dashboard
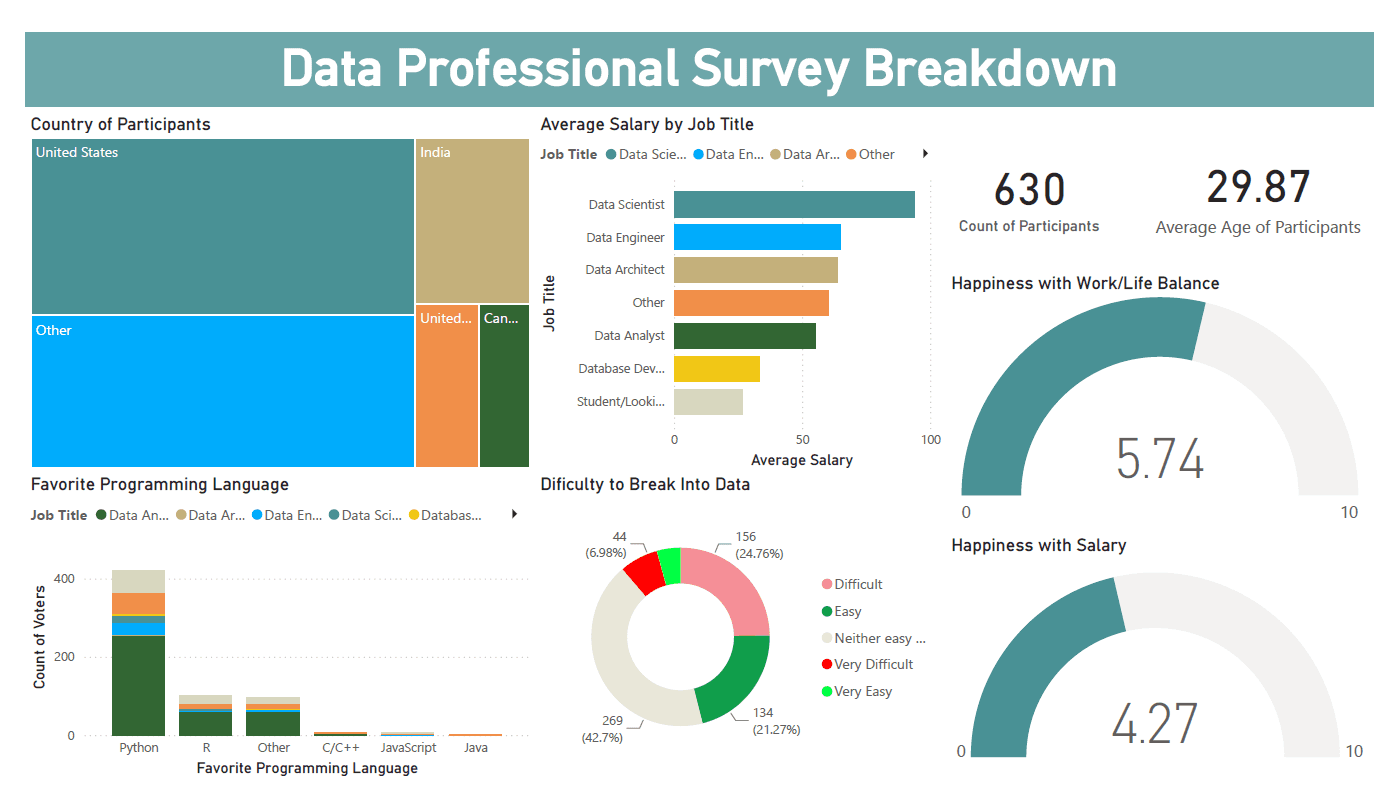
Data was ingested via Power Query to clean inconsistencies, handle missing values, and structure demographic categories. DAX measures were formulated to aggregate average salaries dynamically, calculate sentiment scores, and build percentage breakdowns for career difficulty.
Key Data Insights
01 Python Dominance
Python is overwhelmingly the preferred programming language across all surveyed roles, heavily outpacing R and C/C++, solidifying its status as the industry standard.
02 Salary vs. Satisfaction
Despite Data Scientists and Data Engineers reporting the highest average salaries, overall salary happiness remains remarkably low (4.27/10), indicating compensation expectation gaps.
03 Entry Barrier Perception
Only 21% of respondents felt breaking into the data field was "Easy," with the vast majority rating the barrier to entry as neutral or difficult.
04 Global Distribution
The survey captures a relatively young workforce (Average Age: 29.87), heavily concentrated within the United States and India markets.